
First-Time Buyers Are Paying 191% More Than Their Parents
The generational divide in UK housing affordability has become increasingly stark. Today’s first-time buyers are paying 191% more for their first home than buyers did in the mid-1990s, even after adjusting for inflation. As the market moves toward 2026, rising prices, higher deposits, and tighter lending criteria continue to reshape access to homeownership across the UK.
This article examines the data behind the shift, explains the structural causes, and explores what the changing landscape means for buyers, investors, and the wider property market.
The Generational Price Gap: A 30-Year Transformation
According to data, the cost of buying a first home has increased dramatically over the past three decades.
What First-Time Buyers Paid Then vs Now
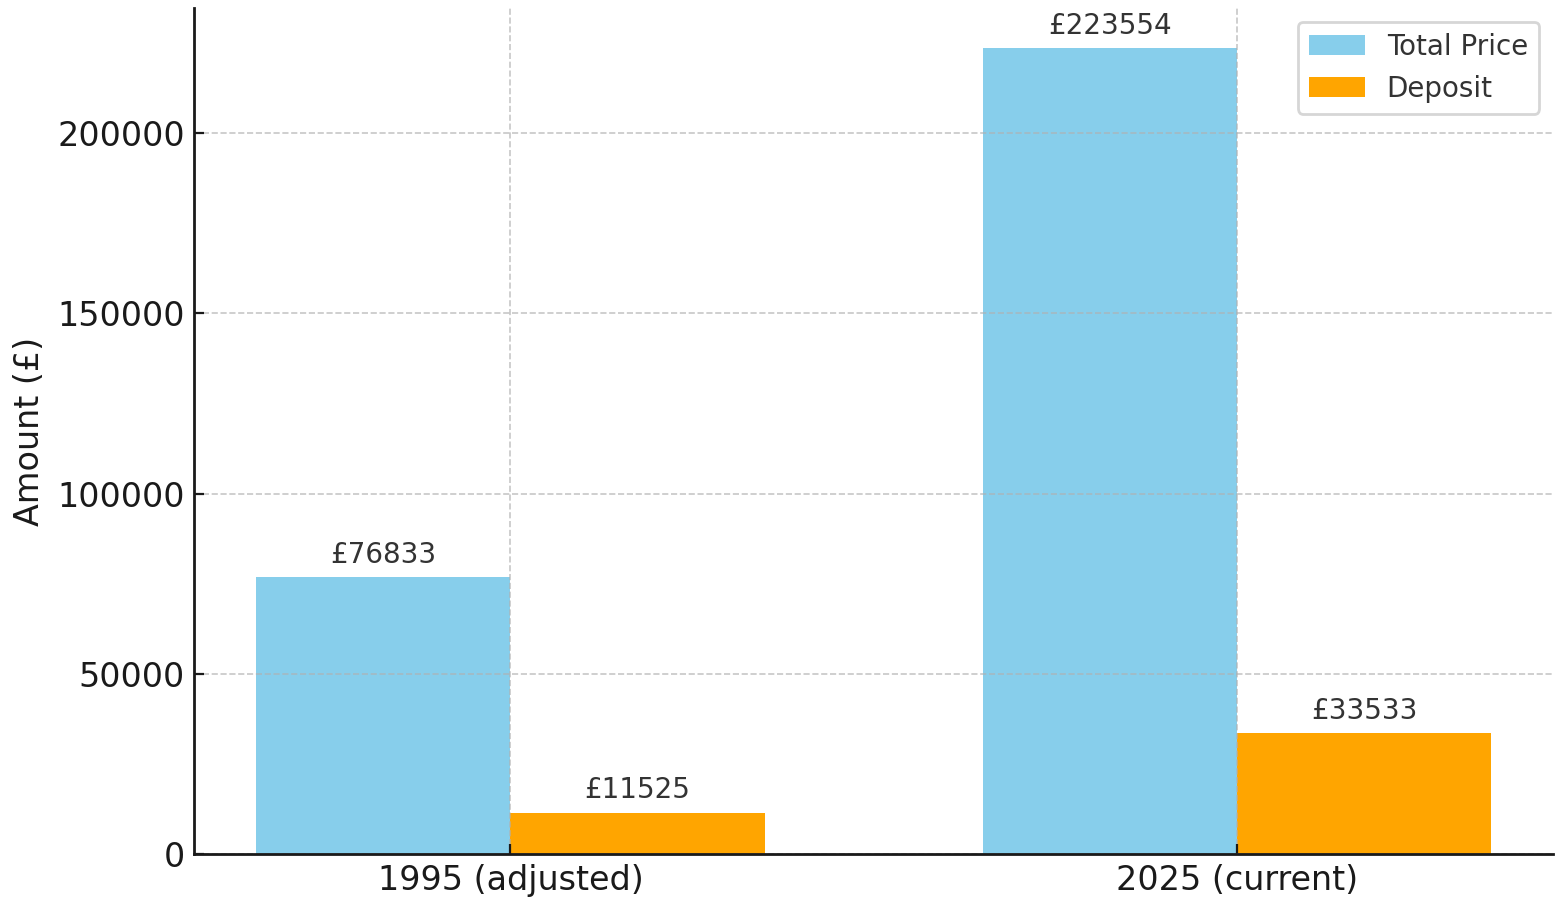
In 1995, the average first-time buyer paid ~£38,806, with a typical 15% deposit of ~£5,821.
Adjusted for inflation, this equates to ~£76,833, with a deposit of ~£11,525 in today’s terms.Today, according to the same source, the average first-time buyer pays ~£223,554, typically with a 15% deposit of ~£33,533.
This represents a real-terms increase of approximately 191% in the purchase price of entry-level homes.
House Prices Relative to Earnings
House Price to Earnings Ratio Over Time
According to long-run affordability data, the relationship between earnings and house prices has deteriorated steadily:
1990s: approximately 4× average earnings
2000s: approximately 6.4×
2010s: approximately 7.1×
2020s: approximately 8.1×
To clarify, a ratio of ~8.1× average earnings reflects a typical house price of ~£280,660 compared with average annual earnings of ~£34,637. The earnings-to-house-price ratio expresses how many times the average annual salary equals the average house price. A higher ratio indicates greater unaffordability, as buyers must commit more multiples of income to purchase a home.
Why the Exact Ratio Varies by Source
The precise ratio depends on the house price measure used and the timing of the data. According to different market sources during 2025:
Halifax reported an average UK house price nearer £299,000 in parts of 2025, reflecting lender-based transaction data.
Provisional ONS estimates suggested average UK prices around £272,000 into late 2025, based on broader transaction inputs.
Zoopla’s House Price Index showed the average UK house price around £268,000–£269,000 in mid-2025, reflecting asking-price and agreed-sale trends.
Using average annual earnings of ~£34,637, these price points imply affordability ratios ranging roughly from 7.7× to 8.6× earnings, depending on the dataset and period referenced.
The Deposit Challenge: Accessibility, Not Acceleration
While deposits have risen sharply over time, the core challenge for modern first-time buyers is not that deposits have grown faster than house prices, but that both have risen far more quickly than earnings in real terms, according to affordability analysis.
Inflation-adjusted average deposit in the mid-1990s: ~£11,525
Typical deposit today: ~£33,533
Inflation-adjusted average annual earnings in the mid-1990s: ~£26,000
Average annual earnings today (mean): ~£34,637
This means real earnings have increased by around 30–35% since the mid-1990s, while deposits and entry-level property prices have increased by around 191% in real terms over the same period.
The real issue is time to save. According to income and rental market data, deposits now represent a significantly larger proportion of annual earnings and require far longer saving periods, particularly for renters facing rising housing costs.
Where First-Time Buyer Deposits Come From
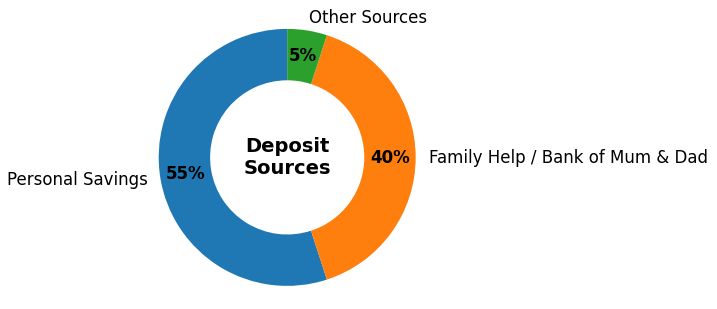
According to recent first-time buyer surveys:
55% of deposits are funded through personal savings
40% involve family assistance, often referred to as the “Bank of Mum and Dad”
5% come from other sources
This marks a clear shift away from the largely self-funded deposits typical of the 1990s and highlights the growing role of intergenerational wealth.
Why Affordability Has Shifted So Dramatically
1. House Prices Have Outpaced Wages
According to long-term economic data:
UK house prices have risen by over 250% in nominal terms since the mid-1990s.
In real (inflation-adjusted) terms, prices are up by around 191%, while earnings have grown by only 30–35%.
This widening gap remains the single biggest driver of reduced affordability.
2. Mortgage Regulation Has Constrained Borrowing Power
According to post-financial-crisis mortgage regulation:
Lenders must stress-test affordability at 3 percentage points above the product rate.
Most buyers are limited to 4–4.5× income, compared with 5–6× income commonly available in the early 2000s.
This has materially reduced purchasing power, even for higher earners.
3. Chronic Housing Undersupply Persists
According to national housing delivery data:
England requires approximately 300,000 new homes per year.
Average delivery over the past decade has been around 230,000 homes annually.
Structural undersupply continues to place upward pressure on prices.
4. Rising Rents Are Eroding Saving Capacity
According to rental market data:
UK rents have increased by 30–35% over the past five years.
Housing costs now consume over 35% of income for many under-35s.
This significantly limits the ability of prospective buyers to build deposits.
What This Means for First-Time Buyers Heading Into 2026
According to recent market indicators, several developments may modestly improve conditions for first-time buyers in 2026:
A more balanced market is easing extreme competition.
Lender competition is improving, including broader availability of 95% LTV products.
Proposed leasehold and commonhold reforms aim to improve transparency and long-term confidence in flat ownership.
While affordability remains stretched, preparation, realistic budgeting, and a clear understanding of borrowing limits are becoming increasingly important.
What This Means for Investors
The affordability challenges faced by first-time buyers also shape investor strategy:
Slower first-time buyer progression may continue to support rental demand.
Regional pricing adjustments may create selective opportunities.
Structural reform could improve governance and reduce long-term operational risk.
Final Thoughts
According to the latest data, first-time buyers approaching 2026 face higher prices, higher deposits, and stricter lending criteria than any previous generation. However, a more balanced market, improving lender competition, and long-term structural reform suggest the landscape is evolving rather than closing off entirely.
Understanding true affordability is now critical. Check out our First Time Buyer Calculator to see how these affordability trends affect your plans and start making informed property decisions today.