
UK Property Market 2026: The Regional Divide
According to the latest ONS release, both rental price inflation and house price growth are continuing to cool, but the nuances matter for UK buy-to-let investors.
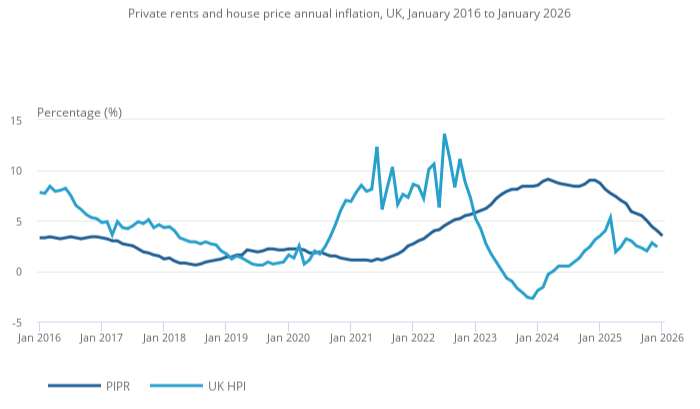
In the year to January 2026, the Price Index of Private Rents (PIPR) showed a 3.5% annual increase in UK rents, the slowest pace since early 2022. Meanwhile, the UK House Price Index reported a 2.4% annual rise to December 2025, down from 2.8% the month before.
This dual moderation, slower rents and slower house prices, plays into multiple market dynamics that every investor must understand in 2026.
The Headline Numbers Investors Need to Know
According to the ONS:
Average UK private rent: £1,367 per month
UK private rent inflation: +3.5% (year to January 2026)
Average UK house price: £270,000
UK house price inflation: +2.4% (year to December 2025)
This marks a continued slowdown in both markets.
However, the national average masks significant regional divergence, and that is where opportunity lies.
Regional House Price Performance
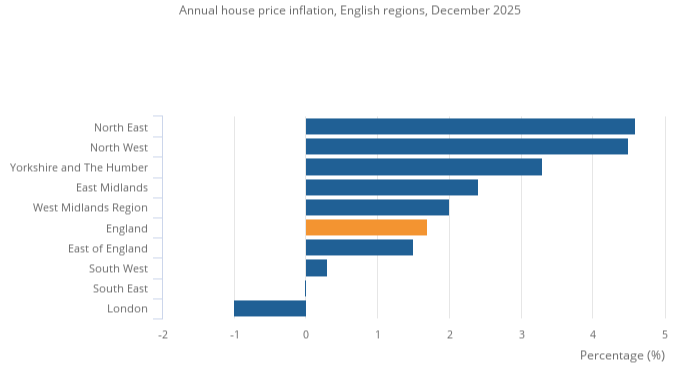
House price growth varies sharply across the UK.
England: £292,000 average price, +1.7% annual growth
Wales: £215,000, +5.0% annual growth
Scotland: £191,000, +4.9% annual growth
Northern Ireland: £196,000, +7.5% annual growth (Q4 2025)
Within England:
North East: +4.6% annual house price growth
London: –1.0% annual change (price decline)
For buy-to-let investors, this confirms a structural shift. Capital growth is no longer uniform. Certain regional markets are outperforming, while parts of London and the South remain under pressure.
Private Rental Inflation: Momentum Is Slowing, But Unevenly
The ONS private rental price index shows:
England: £1,423 average rent, +3.5% annual growth
Wales: £826, +5.8%
Scotland: £1,021, +2.6%
Northern Ireland: £875, +5.6%
Within England:
North East: +8.0% annual rental growth
London: +1.1%
This is a critical divergence.
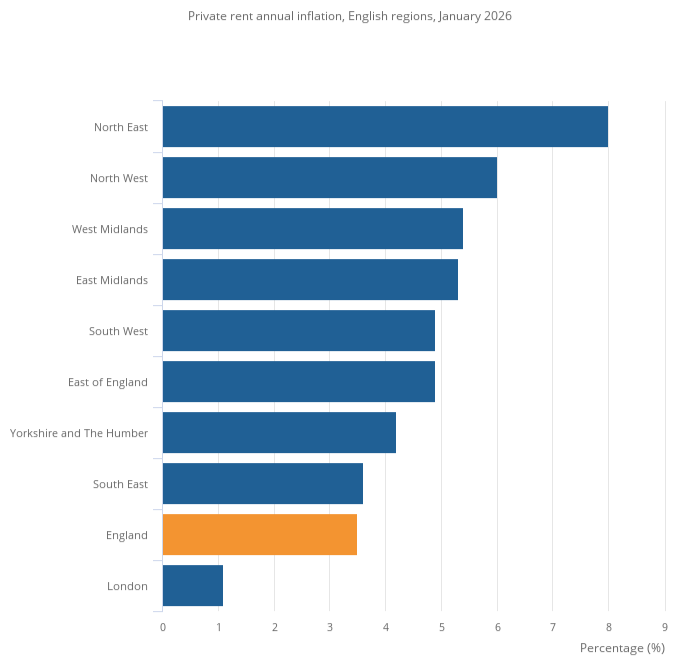
Rental inflation in the North East is more than seven times higher than in London. For yield-focused investors, this matters significantly.
While London rents remain high in absolute terms, growth is constrained by affordability ceilings. Regional markets, by contrast, are still seeing strong rental momentum.
What This Means for Buy-to-Let Investors
1. Rental Yields Are Not Collapsing
Although rental inflation has slowed nationally, it remains positive. In markets where house prices are flat or declining, even moderate rent growth can stabilise, or improve gross rental yields.
In regions like the North East, where rent growth is running at 8.0%, yields may strengthen if purchase prices remain competitive.
This is where strategic allocation becomes key.
2. Slower House Price Growth Creates Negotiation Leverage
UK house prices rising just 2.4% annually, with London showing negative growth, suggests reduced competitive pressure in parts of the market.
For investors, this can mean:
Greater ability to negotiate
More stock sitting longer on market
Improved entry pricing
Better yield acquisition opportunities
Northern Ireland (+7.5%) and Wales (+5.0%) demonstrate that regional markets are not moving in sync. Geographic targeting in 2026 is essential.
3. Tenant Affordability Is Becoming a Constraint
Slower rental growth signals affordability pressure.
In higher-priced cities especially:
Tenants may resist rent increases
Void periods could extend for non-prime stock
Renewal negotiations may soften
Investors relying on aggressive annual rent uplifts should reassess projections. Rent-to-income ratios are beginning to act as a natural ceiling.
4. Mortgage Rates and Cashflow Dynamics
Cooling inflation and moderating house price growth have influenced market expectations around interest rates.
Lower mortgage rates improve investor cashflow, particularly for refinancers.
In a slower growth environment, financing cost becomes one of the most important determinants of net yield performance.
Regional Divergence: The 2026 Investment Edge
The latest ONS data confirms that the UK property market 2026 narrative is no longer national, it is regional.
Strategic investors should focus on yield resilience and localised demand fundamentals rather than relying on broad UK averages.
| Region | Rental Growth | House Price Growth | Investor Implication |
|---|---|---|---|
| North East | +8.0% | +4.6% | Strong rental momentum, attractive yields |
| London | +1.1% | -1.0% | Yield compression risk |
| Wales | +5.8% | +5.0% | Balanced growth and income potential |
| Northern Ireland | +5.6% | +7.5% | Highest capital growth momentum |
Risks Investors Should Monitor
Rent growth continuing to slow below wage growth
Tenant affordability caps limiting increases
Further house price stagnation in high-value markets
Data revisions (ONS figures are provisional and subject to updates)
Opportunities Emerging in 2026
Regional yield re-pricing outside London
Value acquisition in soft capital markets
Improving mortgage affordability
Diversification across nations and regions
The market is not collapsing, it is recalibrating.
For disciplined, data-driven investors, recalibration creates opportunity.
Final Thoughts: Strategic Positioning for 2026
The latest ONS data does not show a crash. It shows moderation.
Rent inflation is slowing but remains positive.
House price growth is cooling but remains uneven.
Regional divergence is widening.
For buy-to-let investors, this means strategy matters more than ever.
Focus on:
Yield stability
Regional data
Tenant affordability
Financing structure
The investors who adapt to the data, rather than the headlines, will outperform in 2026.
Before making your next move, run the numbers using our Investment Property Calculator.
Data-led decisions outperform emotional ones, especially in a shifting market.